- calendar_month October 27, 2023
- folder Market Updates
As we transitioned into the vibrant Fall Season, it's essential to keep a close eye on what’s happening in the Ventura County housing market. This market update provides a comprehensive breakdown of key metrics for both Condominiums, Townhouses and Single Family Residences. Understanding these statistics can be a valuable resource for those looking to buy or sell homes- or those who simply want to stay informed! Let's delve into each part of this market update and learn what it means and why it's of great importance!
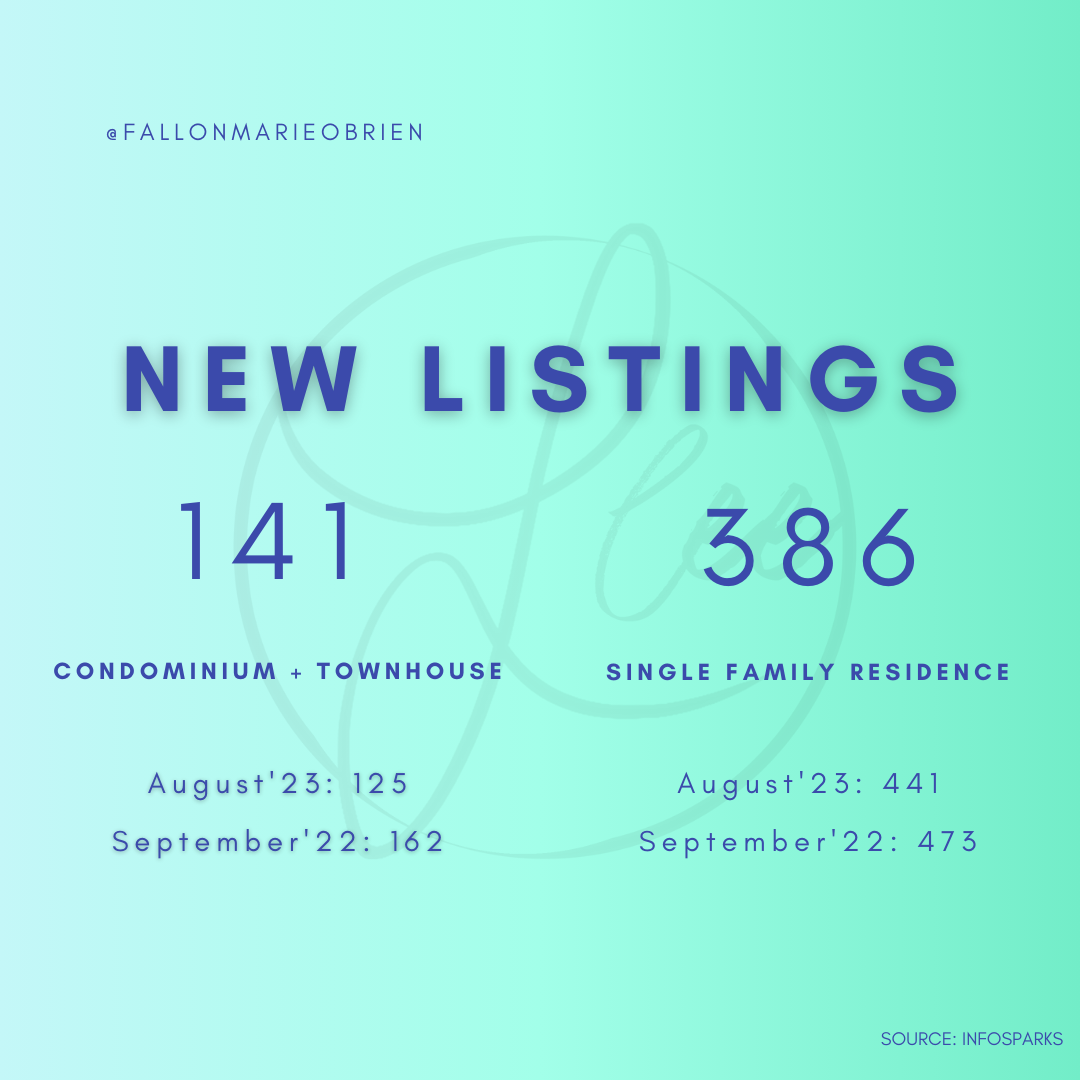
New Listings:
New listings offer a glimpse into the real estate market's health. In September 2023, there were 141 new Condominium and Townhouse listings, a slight increase from August but lower than September 2022. Single Family Residences saw 386 new listings, reflecting a seasonal decrease from August and a year-over-year decline. This data indicates changes in supply and demand, influencing home prices.
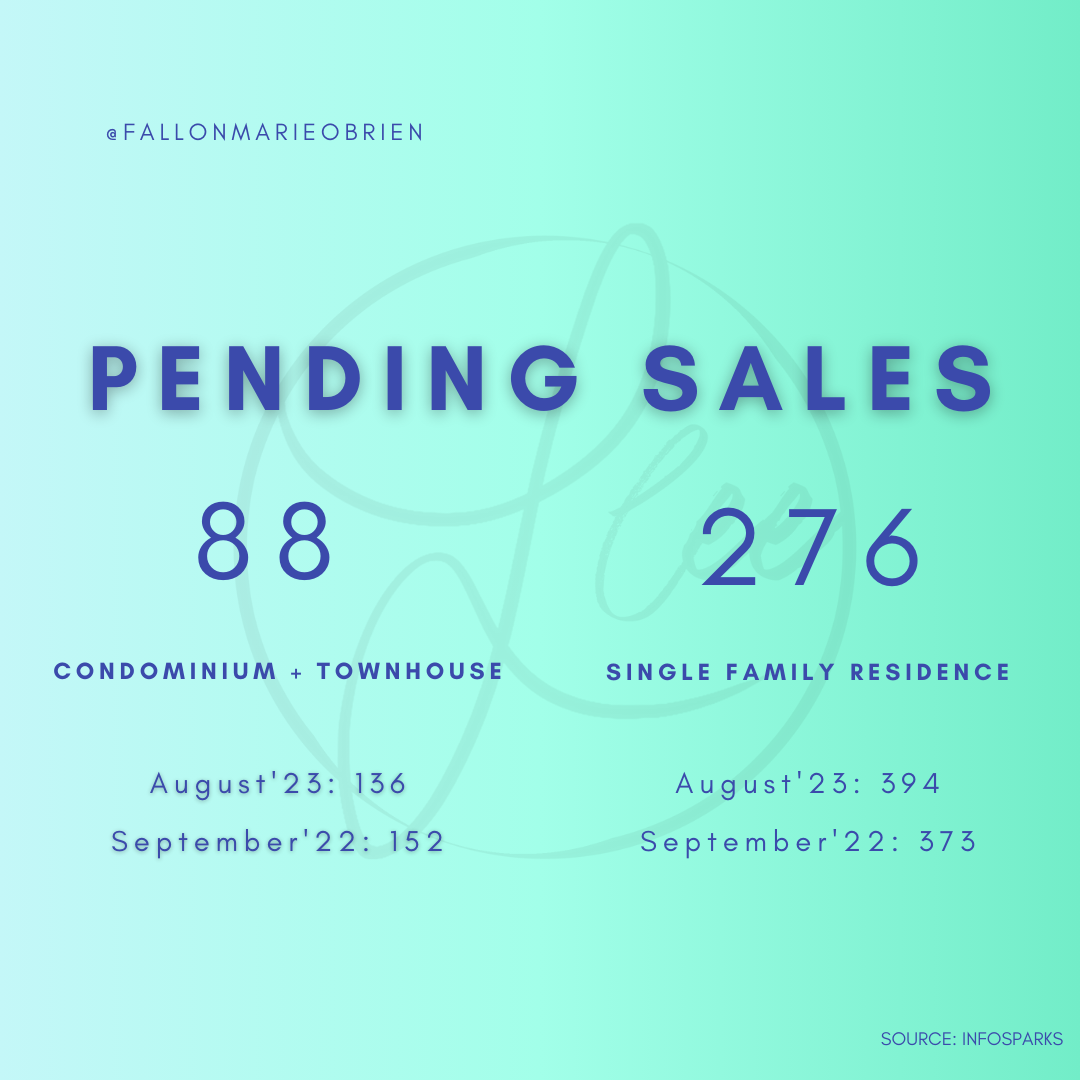
Pending Sales:
Pending sales track the number of properties under contract but not yet closed. For Condominiums and Townhouses, there were 88 pending sales, a significant drop from August and the previous year. Single Family Residences recorded 276 pending sales, also showing a notable decrease. This suggests a potential cooling off in buyer activity, influenced by factors like interest rates and market conditions.
Closed Transactions:
Closed transactions reveal how many homes were successfully sold. In September, 110 Condominiums and Townhouses changed hands, fewer than in August and September 2022. Single Family Residences recorded 330 closed transactions, a decrease from August and the previous year. This reflects the completion of deals initiated in previous months, and trends can indicate market dynamics.
Active Listings:
Active listings highlight the available inventory in the market. For Condominiums and Townhouses, there were 238 active listings, a slight increase from August but lower than September 2022. Single Family Residences had 732 active listings, remaining relatively stable. Comparing year-over-year data shows a significant reduction in inventory. A low inventory may result in higher competition among buyers.
Months Supply:
The months supply metric determines the balance between supply and demand. For Condominiums and Townhouses, the months supply was 2.2, reflecting a seller's market. The same supply was observed for Single Family Residences. A lower months supply suggests that demand exceeds available inventory, potentially driving up prices and promoting competition.
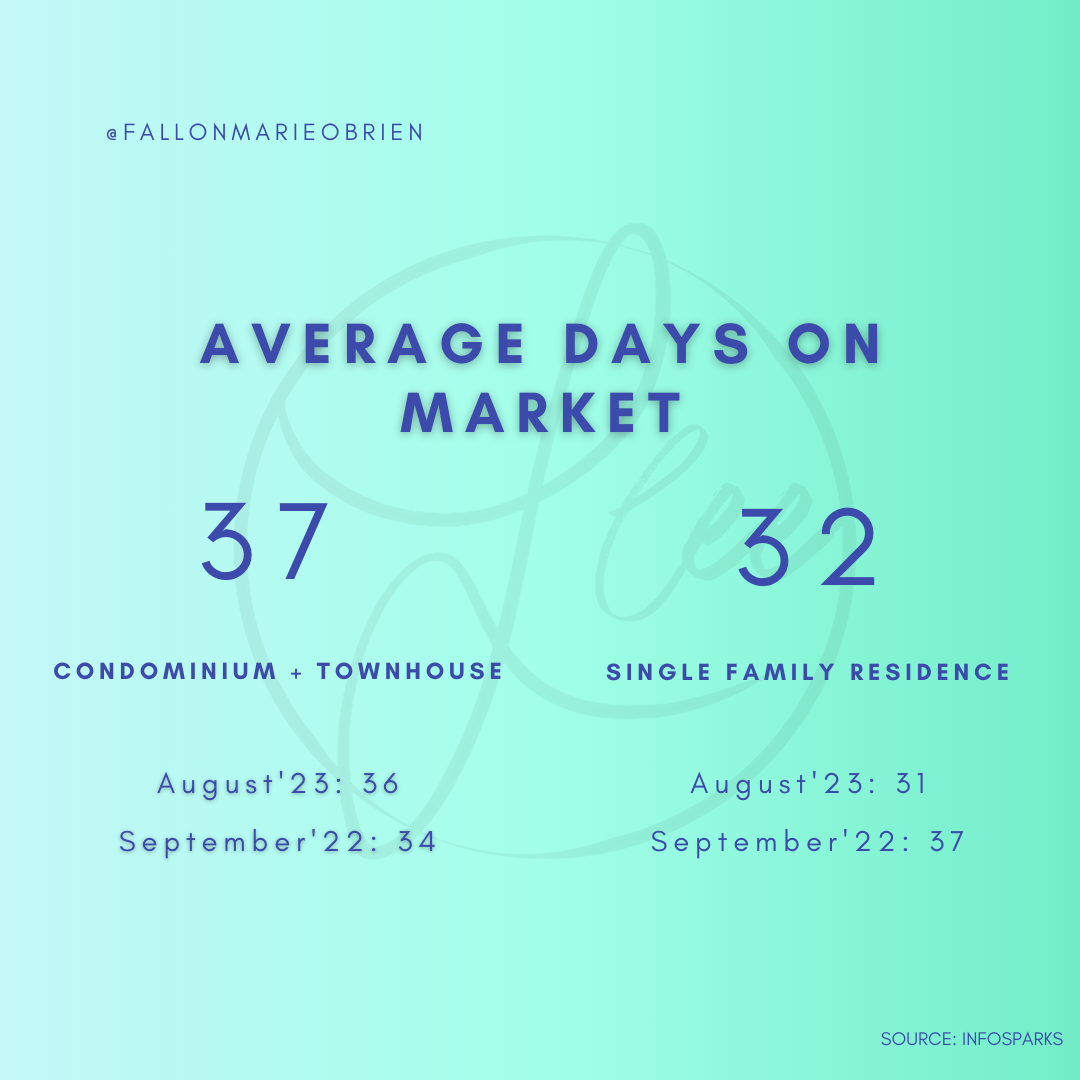
Average Days on Market (DOM):
The average DOM indicates how long homes stay on the market before being sold. In September, Condominiums and Townhouses had an average DOM of 37 days, slightly higher than August but lower than September 2022. Single Family Residences had an average DOM of 32 days, showing homes are selling faster than in the previous year. A shorter DOM suggests a brisk market with strong buyer interest.

Average Percentage of Original Price Received:
This metric measures the price homes actually sell for compared to their original listing price. For Condominiums and Townhouses, the average percentage was 99.3%, slightly lower than August but higher than September 2022. Single Family Residences received 99.7% of their original price, reflecting stability. These percentages indicate the success of negotiations and provide insight into the competitiveness of the market.
Average Shows to Contract:
This metric represents how many showings are needed, on average, to secure a contract. In September, Condominiums and Townhouses required 1.3 showings, while Single Family Residences needed 8.4 showings. Lower showings to contract ratios suggest efficient transactions and strong buyer demand.
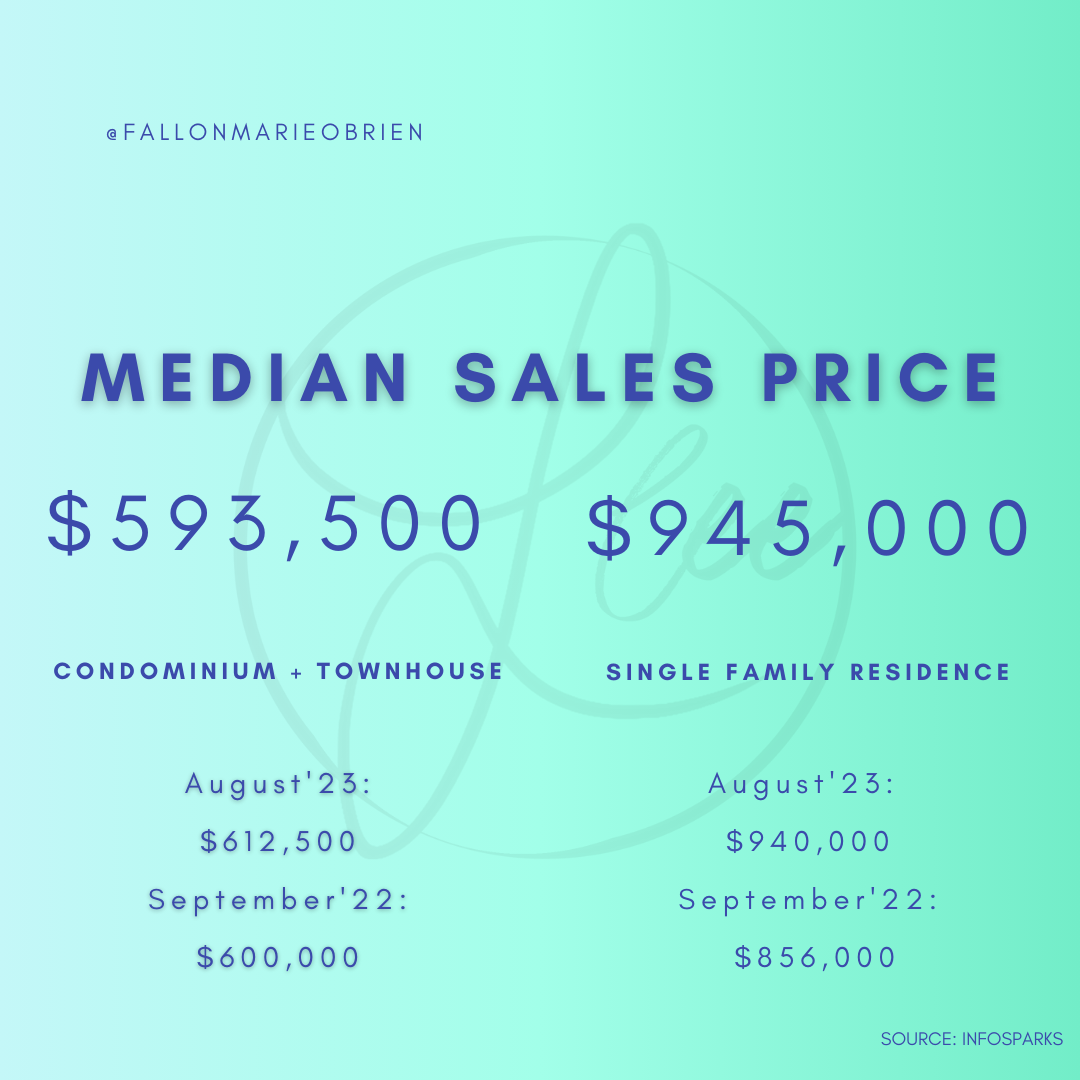
Median Sales Price:
The median sales price is the midpoint of all home sale prices, providing a snapshot of overall market values. For Condominiums and Townhouses, the median price was $593,500, slightly lower than August. Single Family Residences had a median price of $945,000, reflecting a stable market. These figures can guide price expectations for buyers and sellers.
Overall Absorption Rate:
The absorption rate, although given as of August '23, indicates the pace at which homes are selling, with a rate of 45%. A higher absorption rate suggests an active and competitive market.
In conclusion, understanding these market metrics for September 2023 in Ventura County empowers those in the marker to make informed real estate decisions. Whether you're buying or selling, these statistics offer valuable insights into market trends, pricing, and the dynamics of supply and demand. Stay informed and seize the opportunities that align with your real estate goals.
Ready to seize these opportunities? As your local Real Estate Professional, I'm here to guide you and keep you informed! 🏠🔑 Let's make your Real Estate Dreams a Reality!
Contact me today at (805)-236-4993 or fallon@jhagents.com!
